Reviewing Workforce Vacancies
May 2026 – In the 2026 Budget, turnover in the Corporate Fund was budgeted at more than $160,000,000. However, four months into 2026, estimated costs of the City’s workforce vacancies could total nearly 50% of that amount already. Based on monthly workforce vacancy reports published through April, the City’s Corporate Fund vacancies could total more than $75,000,000 beyond budgeted vacancies.
Focusing specifically on the 1 st Quarter of 2026, the City has approximately seven specific funds that deserve additional scrutiny for workforce vacancies, and ten specific departments that deserve additional scrutiny for workforce vacancies. Workforce vacancies create potential opportunity costs because even when additional turnover creates budgeted savings, those budgeted savings must be weighed against any reduced services or additional inefficiencies. It is worth studying workforce vacancies for two specific reasons for 1st Ward residents:
Studying persistent workforce vacancies makes it possible to assess where potential impacts in City services are occurring.
Studying persistent vacancies could demonstrate potential avenues to budget cuts without reducing service levels.
Reviewing Workforce Vacancy
Last year, the City began publishing workforce vacancy data. The 1 st Ward Office studied persistent Corporate Fund vacancies for the first time in June 2025. Each month these data are published, the 1 st Ward Office has downloaded and maintained each “Workforce Vacancy” report published by the City. This allows for extensive analyses of the City’s workforce vacancy performance over the last 14 months now. You can review the data at the City’s Data Portal, and read the department’s reports at the dashboard. Each workforce vacancy spreadsheet follows the same format, which allows for very easy data management and tracking across reports. The latest Workforce Vacancy report was published for May 1, 2026.
In the 2026 Budget Ordinance, the City used a hiring freeze to partially balance the Corporate Fund gap. The hiring freeze was implemented in conjunction with the “Financial and Strategic Reform Options” report, to begin implementing recommendations that rightsize the relationship between management positions and number of supervisees published under each manager.
In the Corporate Fund, these turnover line items totaled more than $160 million in the Corporate Fund, which is the City’s discretionary fund that largely houses the City’s front line services (Table One).
Thus far, through April 30, 2026, City workforce vacancies would be estimated to “cost” more than $80 million in the Corporate Fund. This figure can be constructed by linking the City’s Budget Ordinance spreadsheets with the Workforce Vacancy reports.
On this pace, the City is already reaching 50% of its budgeted vacancy only 33% through the year. From Table 1, below:
On this pace, Corporate Fund vacancies would “cost” the City an additional $75 million. “Cost” is used here in the sense of Opportunity Cost, because it must be noted that wherever there may be Corporate Fund savings due to more vacancies, those vacancies likely come at the cost of fewer City services.
Police vacancies are on pace to finish the year more than $30 million beyond budgeted figure.
Fire vacancies are on pace to finish the year more than $19 million beyond budgeted figure.
Department of Environment vacancies are substantially higher than budgeted figures, which could total more than $3.5 million on its current pace.
Department of Fleet and Facility Management vacancies are on pace to be more than $3.9 million greater than their budgeted amount.
Department of Technology and Innovation vacancies are on pace to be more than $2.4 million greater than their budgeted amount.
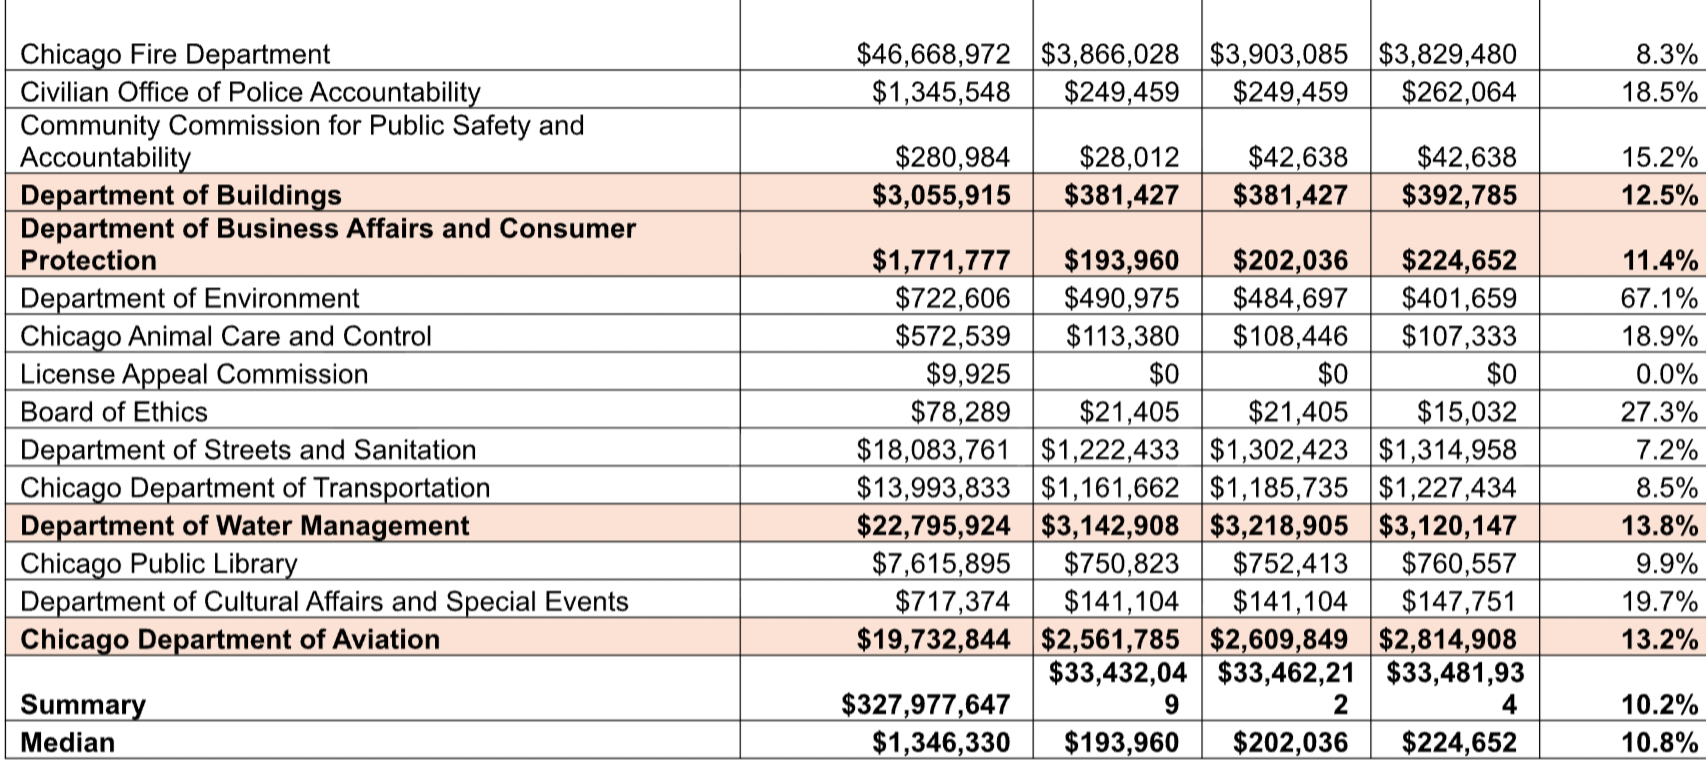
Ironically, despite these persistent vacancies in the Corporate Fund, at the close of Q1 2026, the Corporate Fund was not the worst fund in terms of reaching its workforce goals. Three months in, the Corporate Fund averaged around 9.1% of its monthly budget as vacant; by contrast the average City Fund vacancy stood above 10% of monthly budgeted amounts through Q1 2026 (Table Two).
From Table 2, below, here are the seven funds that deserve more study based on vacancy numbers through Q1:
The O’Hare Airport Fund ($23.0 million average monthly budget) typically saw 14.8% vacancy on a monthly basis, compared to its monthly budget.
The Water Fund ($18.7 million monthly budget) typically saw 13.3% vacancy on a monthly basis.
The Federal Grant Fund ($7.6 million monthly budget) typically saw 11.2% vacancy on a monthly basis.
The Emergency Communication Fund ($6.5 million monthly budget) typically saw 21.3% vacancy on a monthly basis.
The Sewer Fund ($6.5 million monthly budget) typically saw 16.6% vacancy on a monthly basis.
The Library Fund ($6.8 million monthly budget) typically saw 10.6% vacancy on a monthly basis.
Midway Airport Fund ($5.0 million monthly budget) typically saw 13.2% vacancy on a monthly basis.
There are other funds in the City that had worse workforce vacancy performances through Q1 2026, however their typical monthly budget was so small as to deserve less scrutiny; for further study, initial scrutiny should be placed on the Corporate Fund and the largest funds with the largest average vacancy amounts.
The best performing funds in terms of typical monthly workforce vacancies were the Vehicle Tax Fund; Motor Fuel Tax Fund; and Garbage Collection Fund, all of which are funds primarily concerned with essential sanitation and infrastructure services.
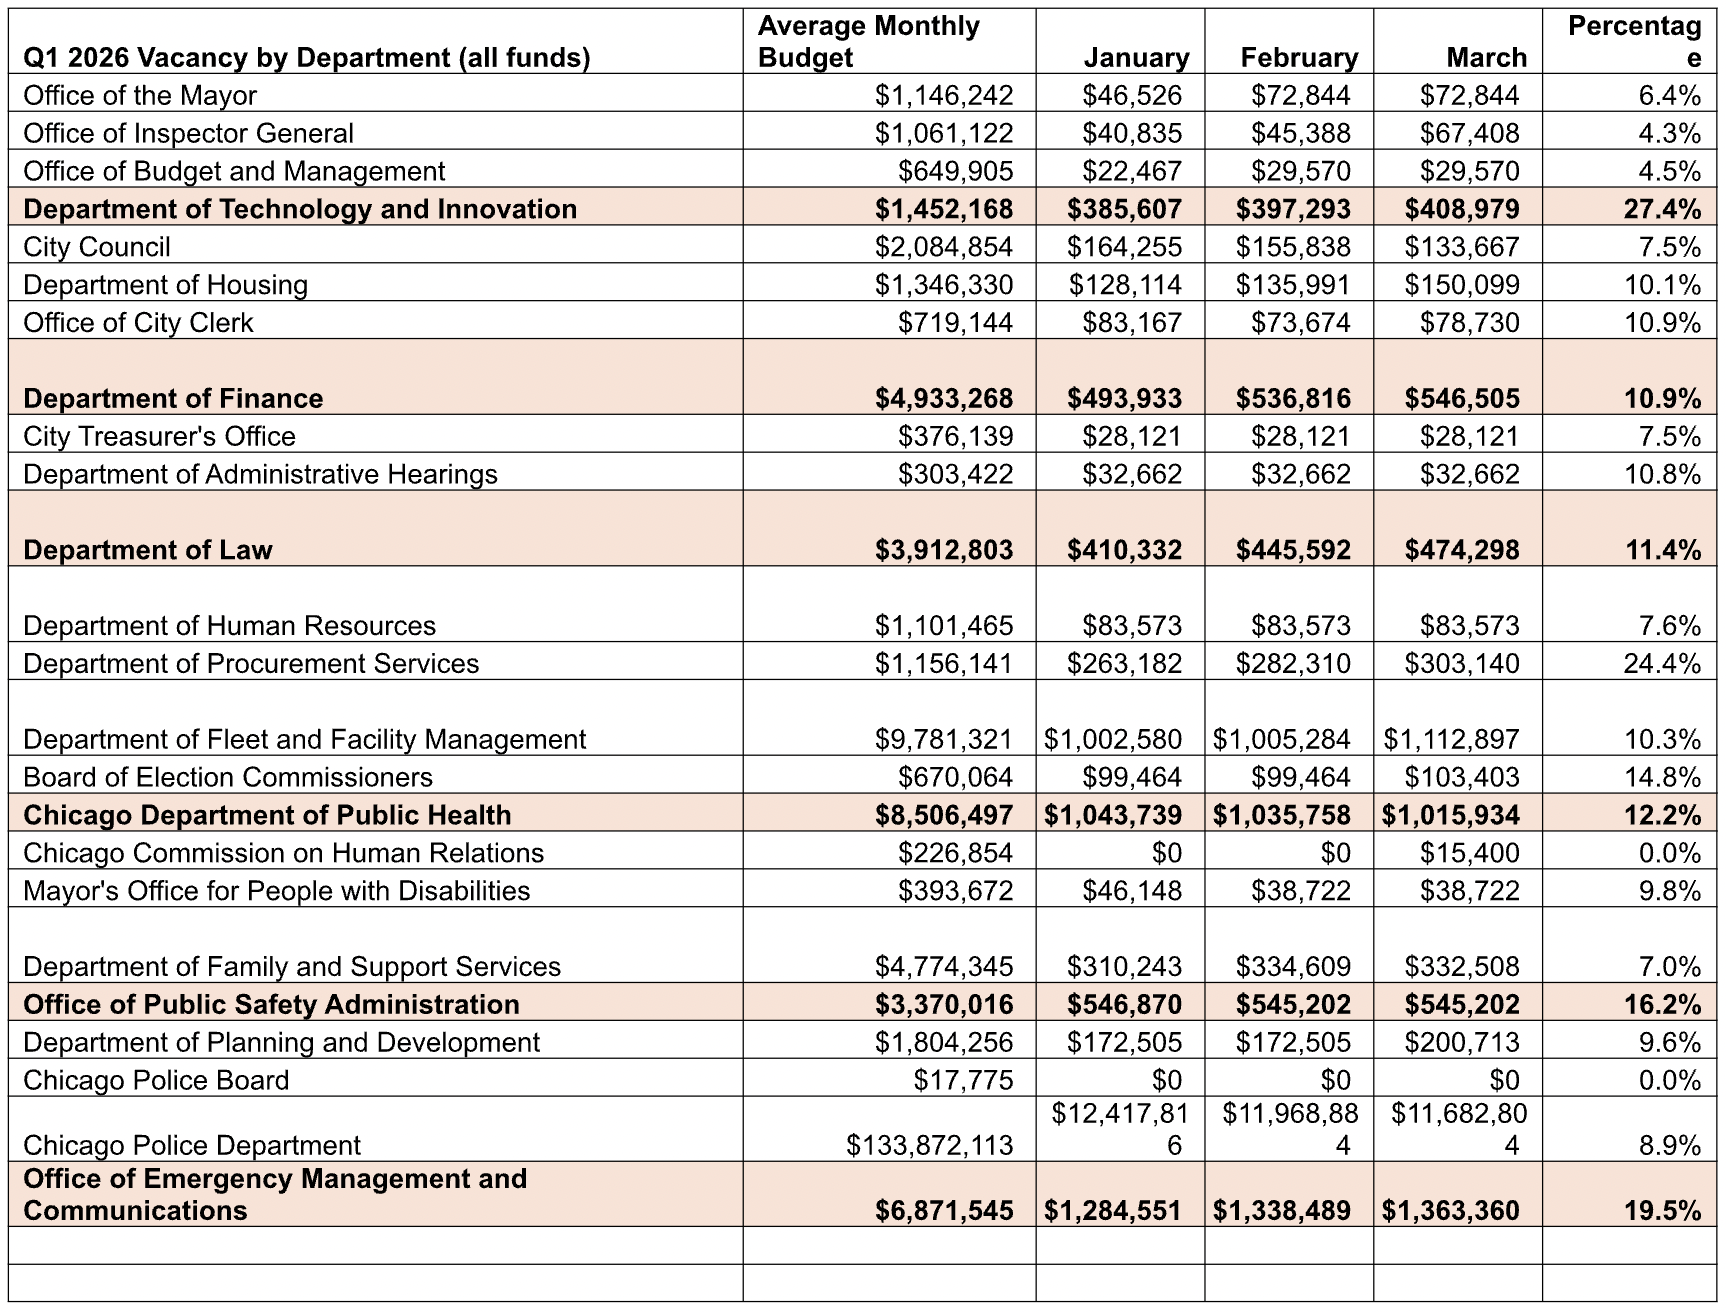
By department, the distribution of median monthly vacancy shifted to 10.8% (meaning for each department, typically 10.8% of their monthly budget would be vacant on any given month. Table 3).
There are ten departments that are worth scrutinizing further for their workforce vacancies through Q1 2026, due not only to the size of their workforce vacancies but also due to their respective budgets. From Table 3, below:
The Water Department (average $22.8 million monthly budget) typically saw monthly workforce vacancies at 13.8% of their budget.
The Chicago Department of Aviation ($19.7 million monthly budget) typically saw monthly vacancies at 13.2%.
Chicago Department of Public Health ($8.5 million monthly budget) typically saw monthly vacancies at 12.2%.
Office of Emergency Management and Communications ($6.9 million monthly budget) typically saw monthly vacancies at 19.5%.
Department of Finance ($4.9 million monthly budget) typically saw monthly vacancies at 10.9%.
Department of Law ($3.9 million monthly budget) typically saw monthly vacancies at 11.4%.
Office of Public Safety Administration ($3.4 million monthly budget) typically saw monthly vacancies at 16.2%.
Department of Buildings ($3.1 million monthly budget) typically saw monthly vacancies at 12.5%.
Department of Business Affairs and Consumer Protection ($1.8 million monthly budget) typically saw monthly vacancies at 11.4%.
Department of Technology and Innovation ($1.5 million monthly budget) typically saw monthly vacancies at 27.4%.
It is important to review ongoing workforce vacancies for two specific policy purposes that are of interest to 1st Ward residents.
First, it is worth assessing workforce vacancies to determine when and how excessive or persistent workforce vacancies are impacting constituent services. For example, in the 2026 Budget, Police and Fire Overtime increased in the Corporate Fund by more than $140 million, but both departments are on pace to exceed their budgeted turnover by more than $40 million; it is worth analyzing whether maintaining higher employment levels would have an impact on overtime hours (ex., reducing overtime hours needed). In terms of City management and efficient maintenance of City resources, similar questions can be asked of vacancies in the Department of Technology and Innovation and Fleet & Facility Management (both of which are on pace to exceed budgeted turnover in 2026).
Second, 1st Ward residents regularly ask Alderman La Spata and the office about service cuts, or what cuts could be made to budget. If the 1st Ward Office can study persistent vacancies, it is possible to assess current levels of service and potential budget cuts via vacant positions. While improving services and creating more efficient services is preferred to cuts, reviewing persistent vacancies could demonstrate potential avenues to budget cuts without reducing service levels.
TABLE 1 – COMPARISON OF 2026 BUDGET ORDINANCE AND WORKFORCE VACANCIES, THROUGH APRIL 30, 2026
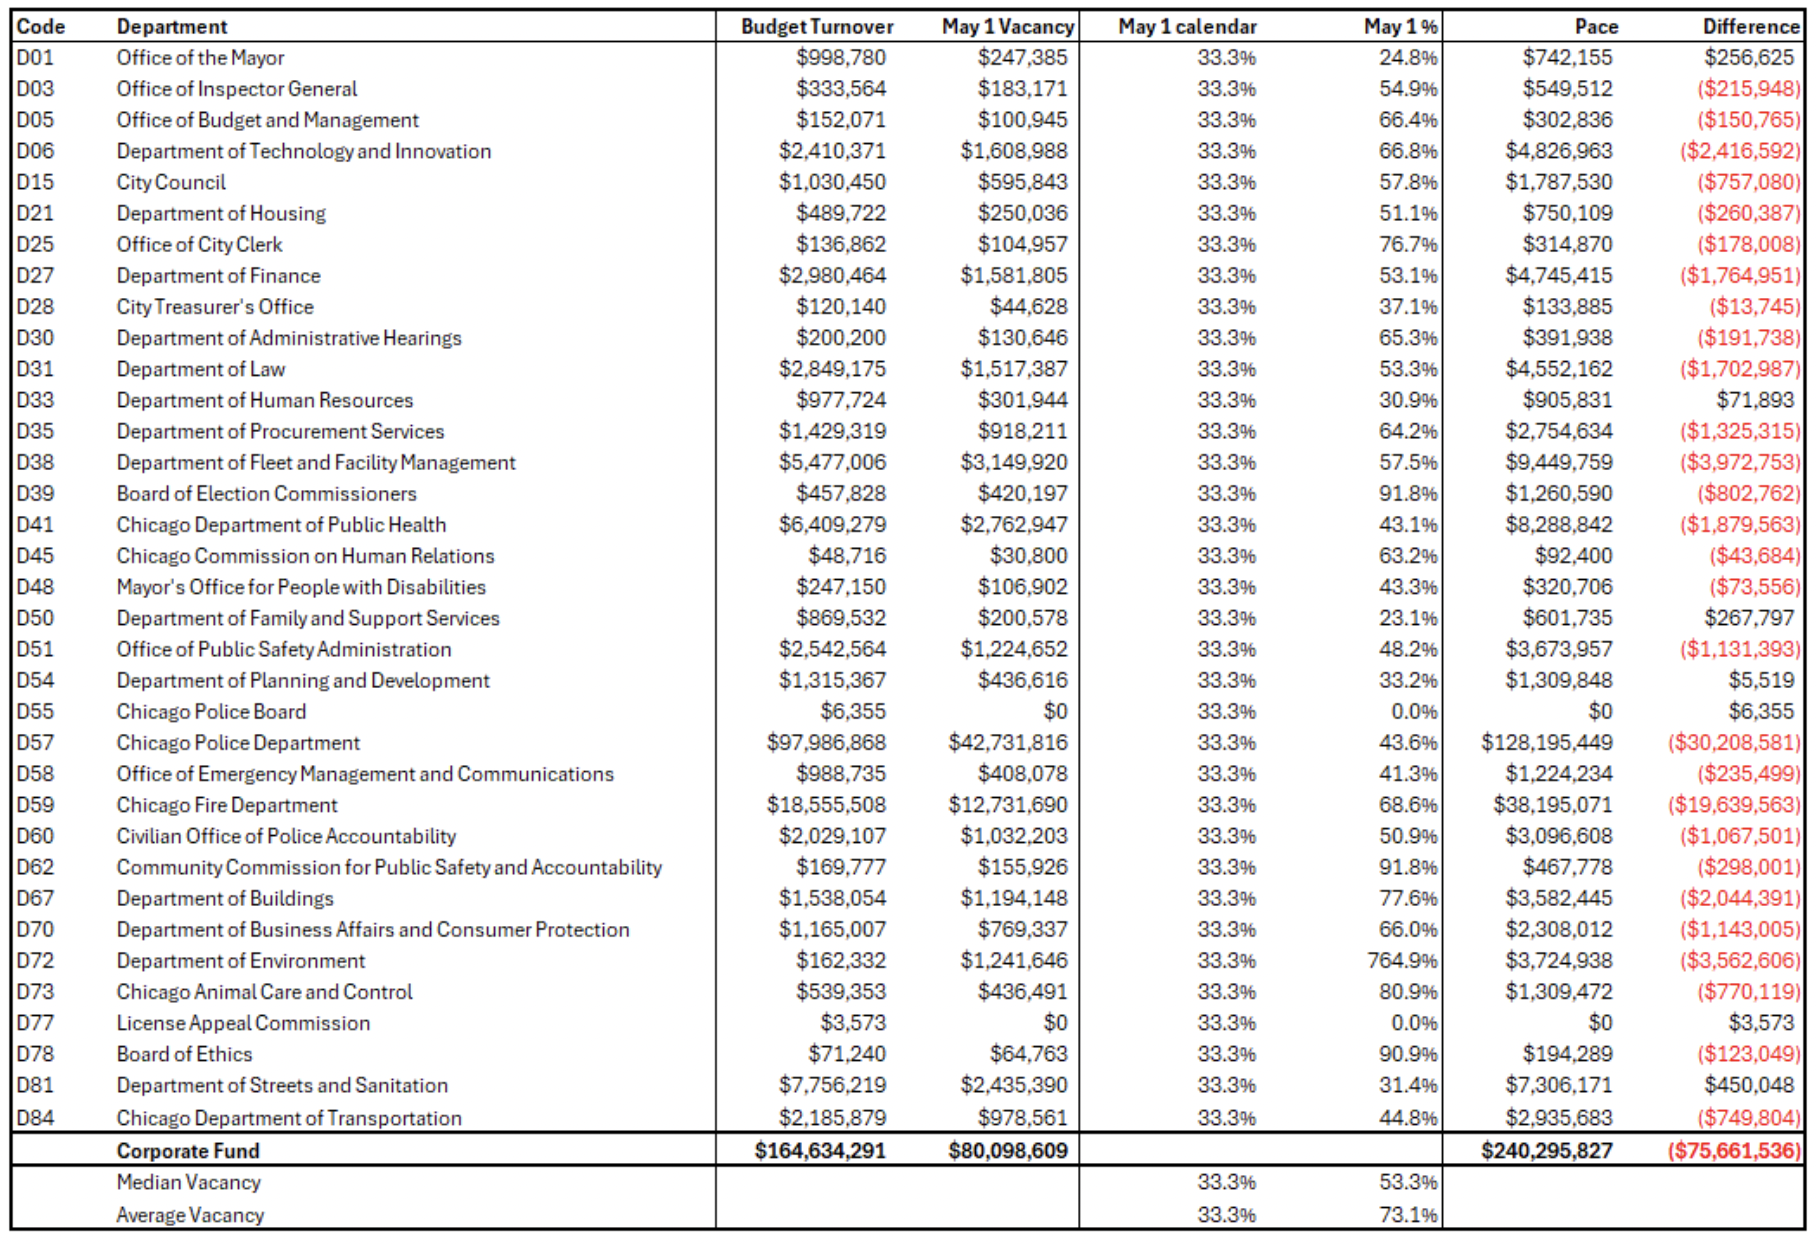
TABLE 2 – WORKFORCE VACANCIES AND 2026 BUDGET ORDINANCE ANALYSIS, 1 ST QUARTER 2026
TABLE 3 – WORKFORCE VACANCIES AND 2026 BUDGET ORDINANCE ANALYSIS, 1ST QUARTER 2026