City of Chicago Annual Audit
July 2026 – The City just released its legally required, annual audit. The 1st Ward staff studies each audit to assess finer points of the implementation of the budget, and to assess general financial and operational functions. Here are some top points of the 2025 audit:
The City’s funded ratio for its pensions has increased yet again in 2025, across all four funds.
The City’s judgments and claims increased more than $250,000,000 in 2025.
In general, the City’s unfunded judgments and claims may be exerting more pressure on the budget than the City’s pensions, now that the City has “climbed the ramp” to meet actuarially required payments.
The City’s governmental capital assets increased, but did not match inflation in 2025.
The City’s general obligation borrowing (for credit lines and bonds) increased more than its governmental capital assets in 2025, which is worth further study to determine how borrowing and infrastructure development converged in 2025.
The City increased it’s general obligation line of credit limit, as well as its line of credit borrowing in 2025.
This practice deserves further analysis, because the City ostensibly uses lines of credit as a predevelopment tool for infrastructure projects because these lines of credit have lower borrowing costs than bonds.
The City spent down more than $1,000,000,000 in governmental investments in 2025, driven primarily by a decline in Special Tax Area balances (ex., Tax Increment Financing (TIF) districts).
This deserves further scrutiny and analysis, to determine the relationship between the large TIF surplus declared in recent budgets; the closing of TIF districts; and any delay in Cook County property tax collections.
The City’s business-like functions (water, sewer, and airports) performed well in 2025, improving balances across all funds and demonstrating strong investment returns.
All four business functions demonstrated both operating income and investment returns that help to easily offset nonoperating expenses.
On July 1, 2026, the City published their Annual Comprehensive Financial Report (ACFR or CAFR), which is the annually required audit. The City’s audit pertains to numerous recent budget blog topics, including discussions of the City’s cash holding and investment trends, and bond trends. The 1st ward Office is studying the audit to prepare talking points and questions for an anticipated mid-year budget hearing, and it is expected that audit blogs may comprise at least two posts (this one will be a top line analysis, and we will hopefully cover a more detailed expense analysis in a future blog).
Without further ado, let’s dive in and read the audit.
Pension Funded Ratio Increased in 2025: First, and perhaps most importantly, the City’s pension funded ratios are headed in the right direction after several years of “climbing the ramp” to make actuarially required payments and making supplemental pension payments.
On pages 12 and 13 of the 2025 ACFR, the audit reports that the aggregate funded ratio for all of the City’s pensions increased from 25.4% to 28.1% in 2025.
The Municipal Employees’ fund increased its ratio from 25.03% to 28.18% (net liability of $14,769,878,000. Pg. 114).
The Laborers’ fund increased its ratio from 44.42% to 45.92% (net liability of $1,760,939,000. Pg. 116).
The Policeman’s fund increased its ratio from 23.86% to 26.44% (net liability of $13,893,194,000. Pg. 118).
The Fireman’s fund increased its ratio from 23.70% to 25.25% (net liability of $6,002,550,000. Pg. 120).
A Brief Survey of Assets and Liabilities: For purposes here, we will focus on assets and liabilities before deferred outflows and deferred inflows are considered (these are basically summaries of expected revenues and previously made payments that are booked in a specific financial manner on the balance sheet; one may debate their status as assets and liabilities in the plain English senses of the words).
On the balance sheet, the City’s net position for the Corporate Fund (ex., governmental functions) has declined by roughly $1.8 billion. Rather than stopping with those large numbers, it is worth investigating the performance of actual assets and liabilities.
For capital assets, governmental capital assets increased nearly $199,000,000 between 2024 and 2025, which lags inflation by roughly $65,000,000 (pg. 35). (See Table One for more detailed figures)
For the City’s business-like functions (ex., airports, water, sewer), capital assets increased by more than $541,000,000 between 2024 and 2025, which outpaces inflation by $22,000,000 (pg. 35).
For all other assets, governmental assets declined by more than $485,000,000; against inflation, this is a virtual change of nearly $780,000,000 (pg. 35).
As will be discussed in more detail below, this decline in largely due to a decline in the City’s governmental investments (which is separate from its pension investments).
By contrast, for business functions, all other assets increased by more than $1,000,000,000, beating inflation by more than $865,000,000 (pg. 35). As will be discussed in more detail below, the City’s business functions are performing in quite a healthy manner, at least on the balance sheet.
Focusing on select government liabilities: (See Table Two for more specific details)
The City’s judgments and claims increased to more than $1,650,000,000, which is an increase of more than $250,000,000 beyond inflation (19% change).
One could arguably make the case that the City’s ongoing unfunded judgments and claims are now providing a more difficult aspect of budget management than the City’s pension liability, since the City has now “climbed the ramp” to make its actuarially required payments for several years.
One should recall that one of the major controversies of the 2026 Budget was financing large master settlements with bond financing, which essentially places an operating cost on borrowing, thereby substantially increasing the cost of those settlements to the City.
The City’s general obligation lines of credit increased by nearly 60%, to a balance of more than $550,000,000 (pg. 262).
These lines of credit stood at 70% borrowing capacity at the end of 2024 ($490,500,000 credit limit in 2024, see page 262 2024 ACFR), and 92% borrowing capacity at the end of 2025 ($600,000,000 credit limit in 2025, see page 262 2025 ACFR).
This borrowing capacity increase deserves further scrutiny, as do the balances. However, the timing of general obligation bond issuances could impact these balances, as the City’s top financial and budget officers have noted in recent Committee on Finance hearings and communications to the 1st Ward Office that general credit lines are used as a lower interest rate “predevelopment” financing source for infrastructure, to then be “knocked out” by general obligation bonds or Sales Tax Securitization Corporation issuances.
If this strategy ensures that the City is not issuing expensive general obligation bonds and simply holding on to the proceeds while they await project development, this could actually be a beneficial strategy even if it looks like the City is holding more debt on its credit lines. Thus, this specific area of the audit deserves scrutiny and analysis.
The City’s Sales Tax Securitization bond balances (principal and interest) are quite healthy against inflation; the City’s STSC interest owed actually improved in 2025 from 2024, and the principal owed only slightly increased (pg. 31).
The City’s general obligation bond principal expanded by roughly 4%, and interest payments owed expanded by 5% between 2024 and 2025. Against inflation, this amounts to long-term increases of more than $390,000,000 (pg. 31).
It should be noted that even though general obligation bond principal increased by more than $390,000,000 against inflation and general line of credit balances increased by more than $200,000,000, the value of capital assets only increased $199,000,000 in 2025. It is worth analyzing further the relationship between capital asset valuation and debt issuances, because debt issuances ostensibly finance infrastructure investments that would comprise capital assets.
TABLE 1 – Assets and Liabilities
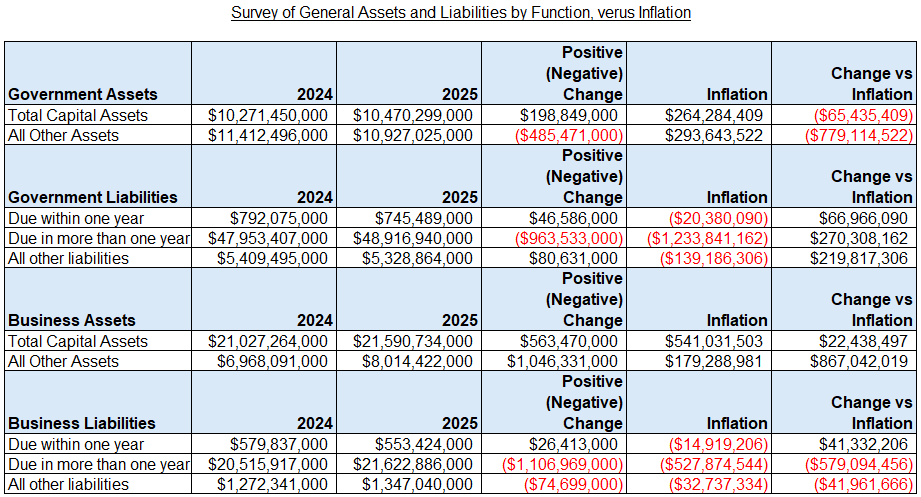
TABLE 2 – Government Liabilities
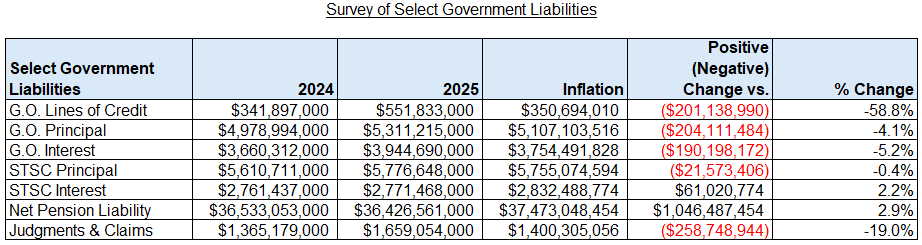
G.O. = General obligation; stsc = sales tax securitization corporation
TABLE 3 – Sales Tax Securitization Corporation and Governmental Bond Principal
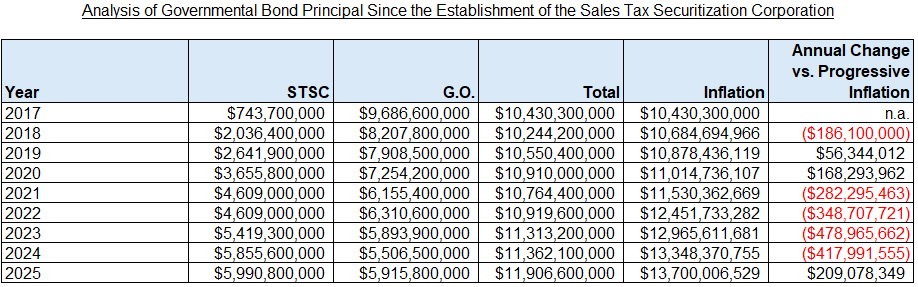
G.O. = General obligation; stsc = sales tax securitization corporation
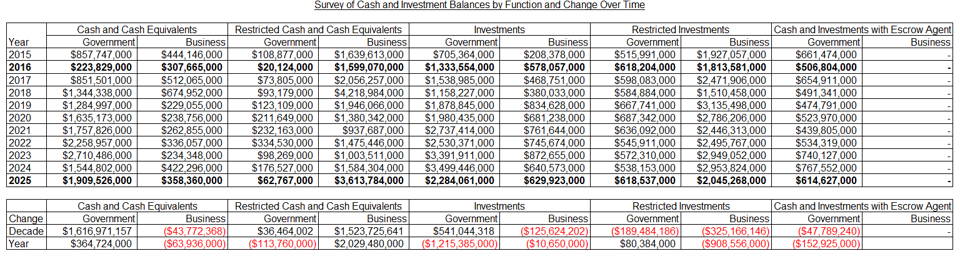
Cash and Investments: As has been discussed recently on this blog, despite the City’s budgetary woes, the City is effectively implementing a cash and investments build up over the last decade. This strategy deserves further analysis and scrutiny, both in terms of how effective cash management can essentially improve the City’s liquidity and therefore its standing with ratings agencies, and in terms of any strain placed on the budget by not returning excess investment cash back to the budget.
Overall, the City’s governmental cash and investments across all types (restricted and unrestricted cash and investments, and escrow cash and investments) declined by more than $1,000,000,000 in 2025:
Governmental cash increased more than $250,000,000, driven primarily by an increase in unrestricted cash balance and a decrease in restricted cash balance.
Governmental cash and investments held by escrow accounts declined by $150,000,000.
Governmental investments declined by more than $1,100,000,000, driven by a decline in unrestricted investment balances.
By governmental function, this decline was driven by an extremely large decline in Special Taxing Areas investments held (ex., Tax Increment Financing districts); Federal, State and Local Grants investments; general governmental investments; and, Community Development and Improvement Projects investments held (ex., debt vehicles awaiting infrastructure use).
To determine the significance of declining Special Tax Area investment balances, one should study further the relationship between the large Tax Increment Financing surplus established in the 2026 Budget, which was one of the points of contention in budget hearings; the closure of certain Tax Increment Financing districts; and, potential delays in property tax collections.
By contrast, the City’s business-like functions (ex., airports, sewers, water) saw their cash and investment balances increase by more than $1,000,000,000 across all types (restricted and unrestricted cash and investments):
Business cash increased by nearly $2,000,000,000 in 2025, due primarily to a substantial increase in restricted business cash (in 2025, the City held more than $3,600,000,000 in restricted business cash).
Business investments declined by more than $900,000,000 in 2025, due primarily to a decline in unrestricted investments.
One should further research the City’s large lead-service line replacement projects; water main projects; other sewer investments; and large airport projects, to further discern the importance of this expansion in cash on hand, and the apparent (ostensible) transfer of business investments to business cash.
TABLES 4 and 5 - Cash and Investments
Business Balances Boom: In contrast to the City’s Corporate Fund, which is covered extensively at this blog as the City’s discretionary governmental fund that houses the everyday governmental services 1st Ward residents most commonly associate with the City, the City’s business functions are booming.
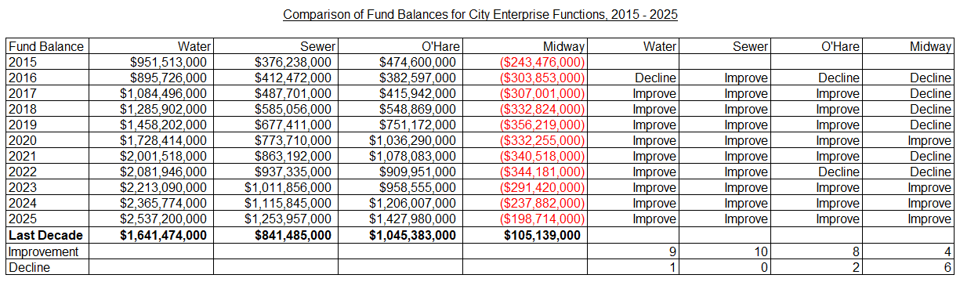
Every business-like function improved its fund balance in 2025: (See Table Six for more detail)
Midway continued its improvement on the balance sheet with its third consecutive positive balance, ending the year with an improvement of $39,000,000 against 2024.
While Midway continues to have a negative balance overall, its position has improved by more than $100,000,000 over the last decade, and its negative balance sheet position is below $200,000,000 for the first time in a decade.
O’Hare outperformed all other business funds, improving its balance by more than $220,000,000 in 2025.
Over the decade, O’Hare has improved its position by more than $1,000,000,000.
The Water Fund continued its decade-long balance expansion, improving its balance more than $170,000,000 in 2025.
Over the decade, the Water Fund has improved its position by more than $1,600,000,000.
The Sewer Fund wasn’t that far behind, improving its balance more than $130,000,000 in 2025.
Over the decade, the Sewer Fund has improved its position by more than $800,000,000.
In addition to its positive balance sheets, business like funds demonstrate solid operating income and investment performances:
In 2025, Midway reported more than $28,000,000 operating income and more than $17,000,000 in investment returns.
In 2025, O’Hare reported more than $200,000,000 operating income and more than $130,000,000 in investment returns.
In 2025, the Water Fund reported more than $200,000,000 operating income and more than $46,000,000 interest income.
In 2025, the Sewer Fund reported more than $168,000,000 operating income and more than $27,000,000 investment income.
TABLE 6 - Enterprise Funds